Turning campus energy data into a physical interactive display
Summary
Project Detail
The brief was to analyse power usage data from Avans University and translate it into a physical installation. Rather than presenting the data as a chart or screen, we wanted something people could interact with and draw their own conclusions from.
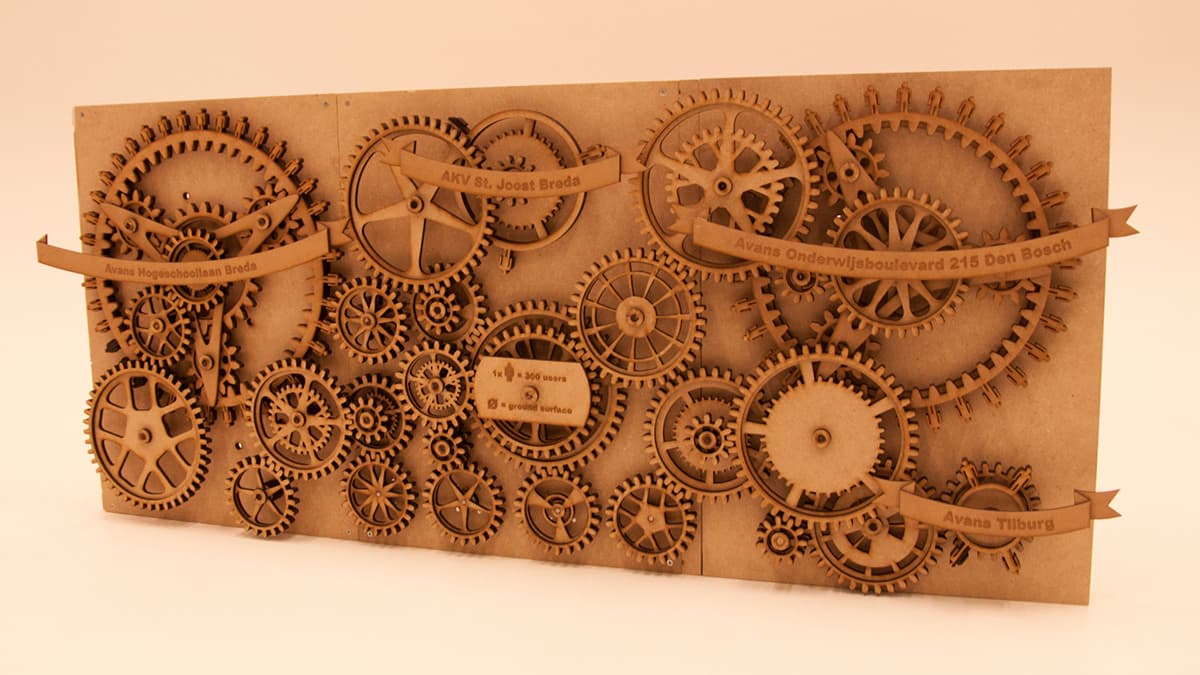
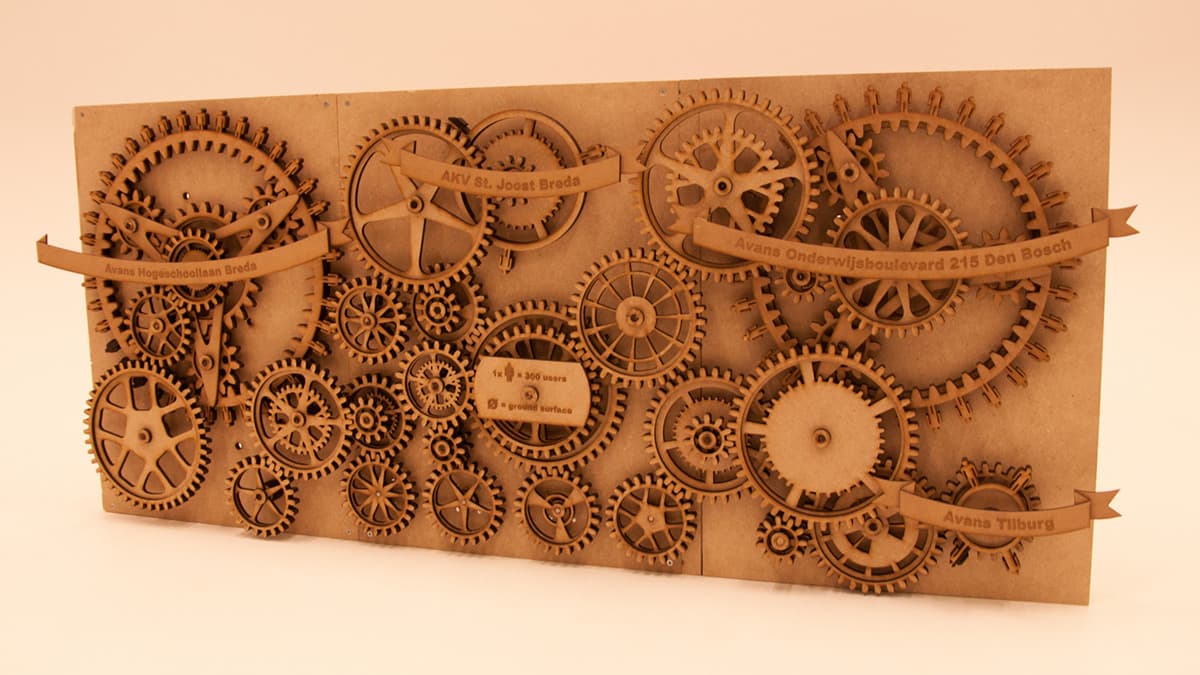
The initial concept used lightbulbs that would illuminate once a building's running cost was reached through a money-based input. Through the design process this evolved significantly. We realised the gears themselves could carry the data, using size to represent building footprint, and small engraved figures around the edge to show the number of students and employees. The density of those figures communicated occupancy per square metre.
The input mechanism went through a similar evolution. We originally planned physical coins that users could insert, but this created practical problems around feedback, removal, and exhibition reliability. We replaced it with a physical slider that solved all three issues cleanly within the project timeframe.
The gears were designed using geargenerator.com, laser-cut from wood, and assembled into a planetary gear system. Getting the planetary gears right required precise calculation (Ring = 2 x Planet + Sun), manual tooth reshaping, and a custom solution to stop the ring gear from wobbling when the installation stood upright. The electronics were first prototyped on a breadboard, then moved to a custom PCB design to reduce size and improve reliability. Controlling multiple stepper motors simultaneously required finding the right library, as most available options did not support simultaneous multi-motor control with our motor shield.